Logistics and Supply Chain System Analysis

This site is the homepage of the course titled “Logistics and Supply Chain System Analysis” taught in the MBA in Logistics and Supply Chain Management at Mae Fah Luang University in Chaing Rai, Thailand.
Outline
Introduction (pdf)
Week 1:
1.1 Defining Logistics and Supply Chain
Slide1, CSCMP Glossary of terms in SCM
1.2 Case Study
Frito-Lay Supply Chain
1.3 Supply Chain Design – Start with Why
Watch Simon Sinek’s TED Talk on why leading companies are successful, so do the successful supply chain.
Week 2:
2.1 Supply chain mapping tools (pdf)
SCOR Model version 10.0 (pdf)
Business Canvas
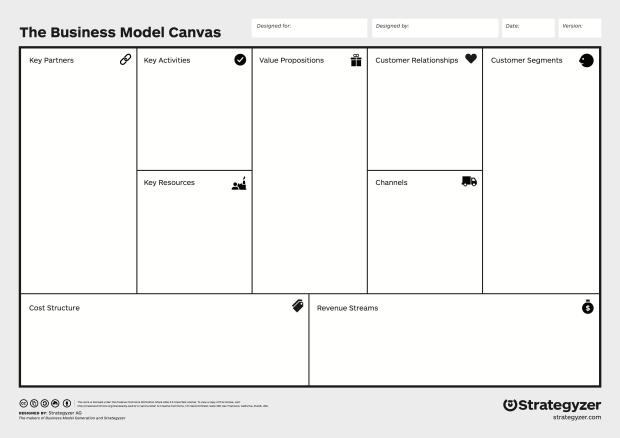
The Business Canvas book (Free Preview) (PDF)
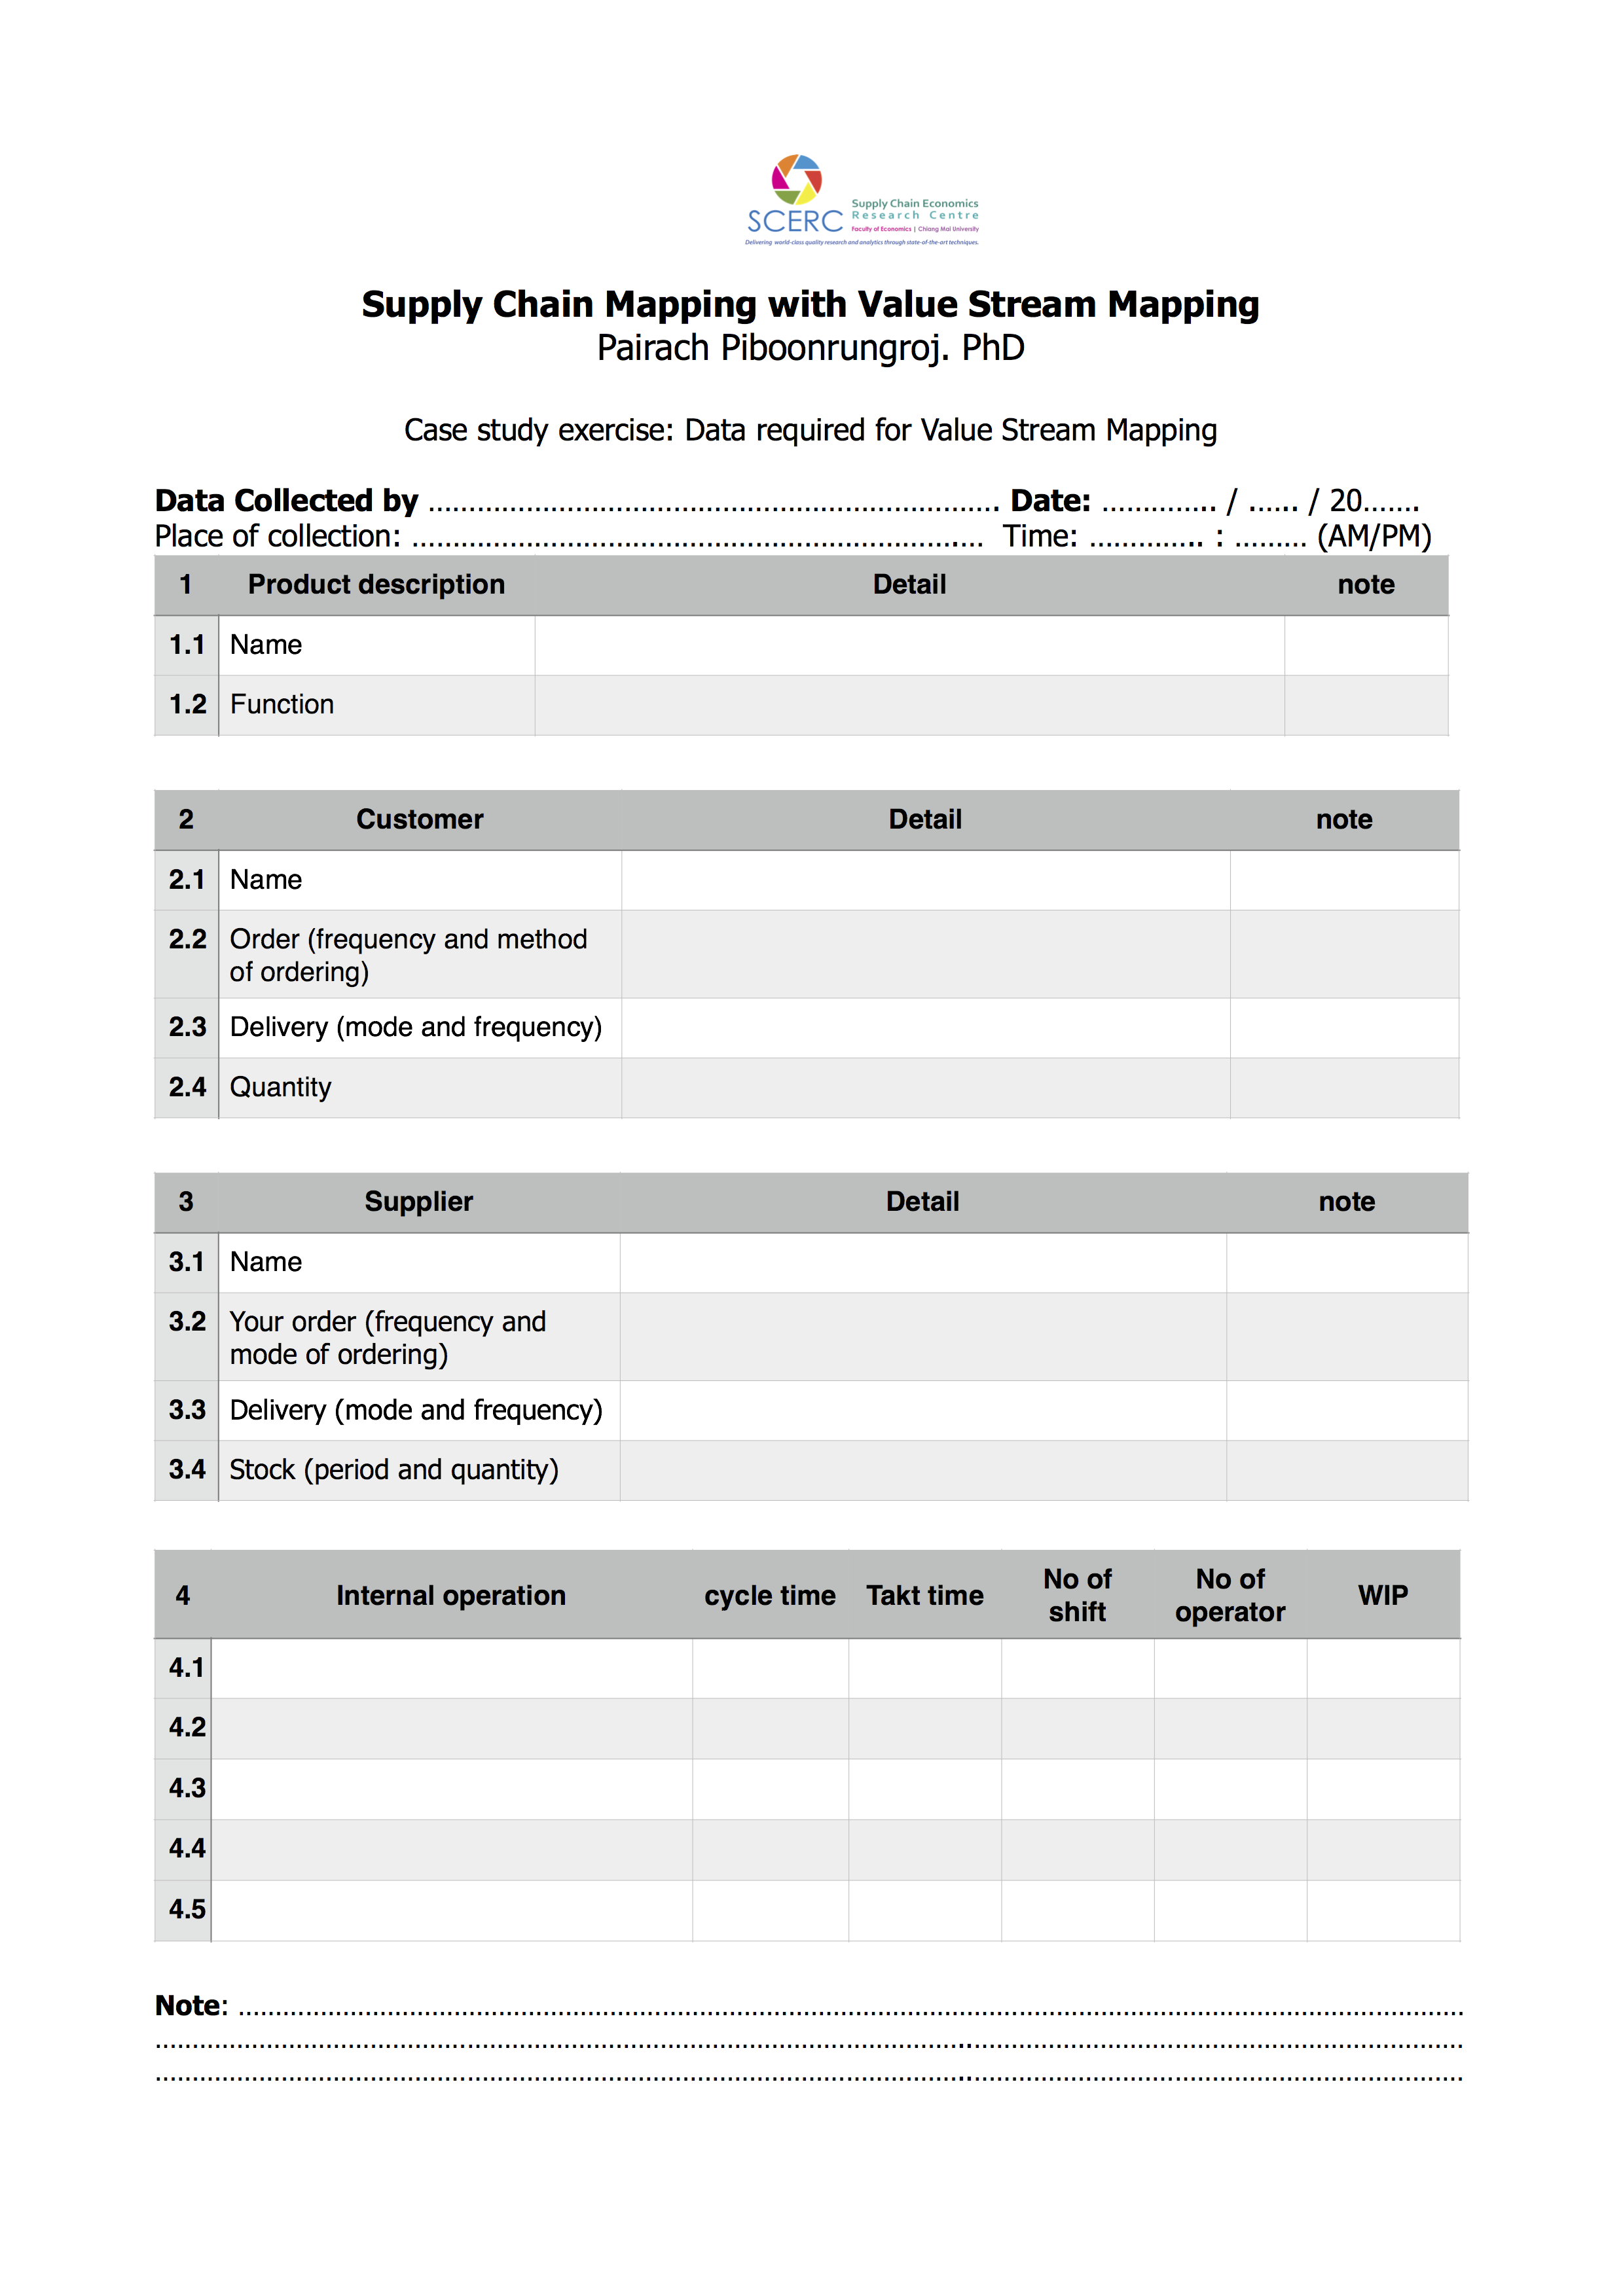
Lean Pilot
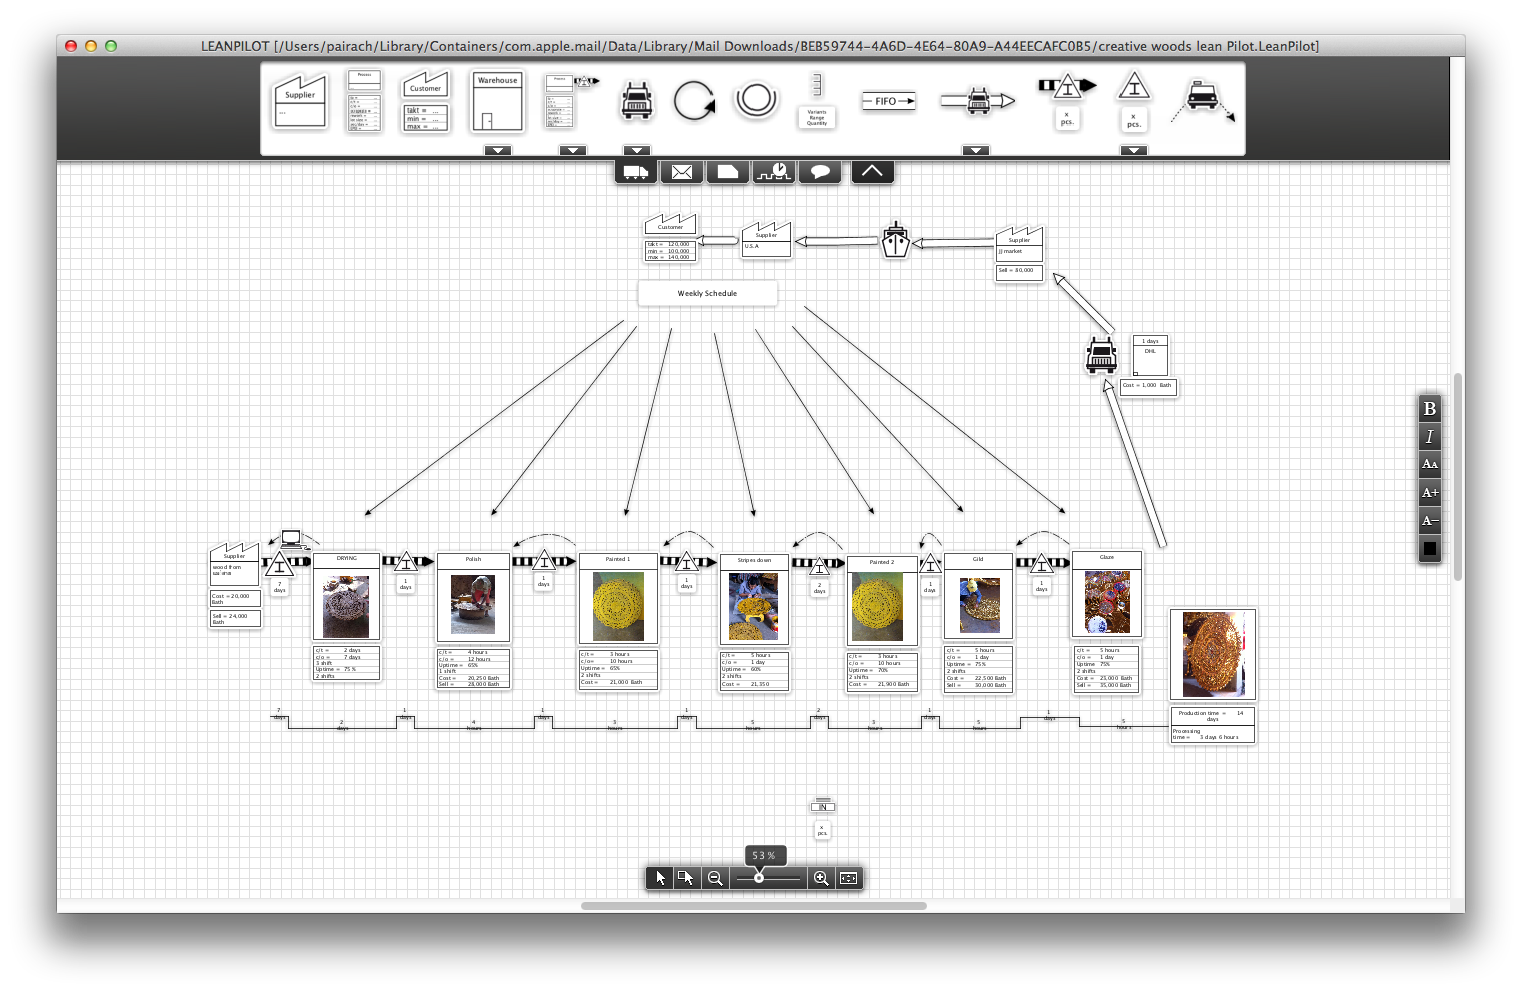
- VSM data collection form (pdf)
- Seeing the Whole Value Stream by Dan Jones and James Wormack (pdf)
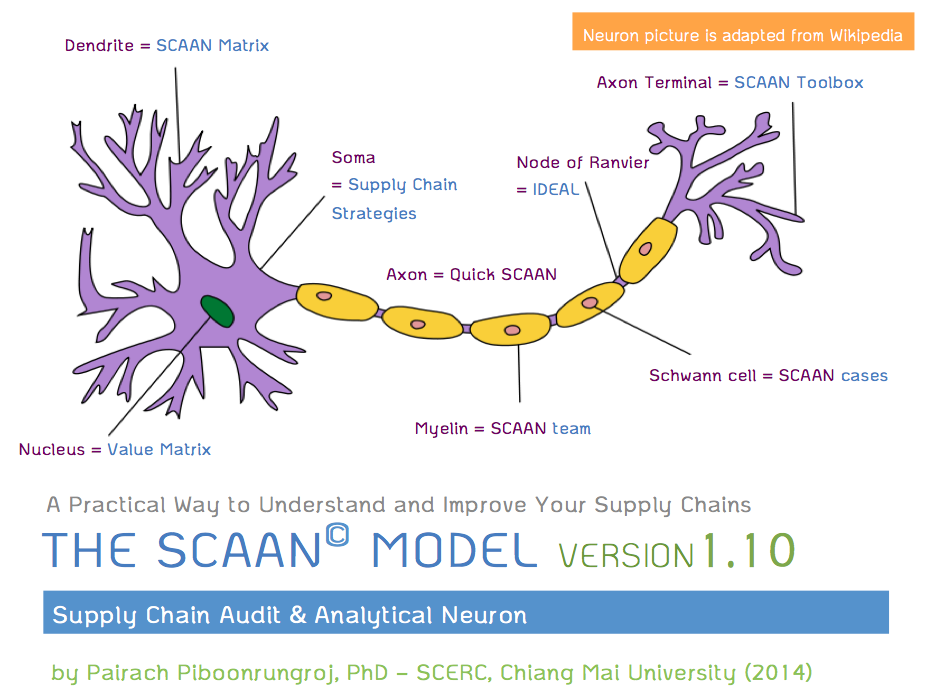
2.2 SCAAN Model – A Practical Supply Chain Diagnosis Method (pdf)
Week 3: Supply Chain Collaboration
3.1 Supply Chain Relationships
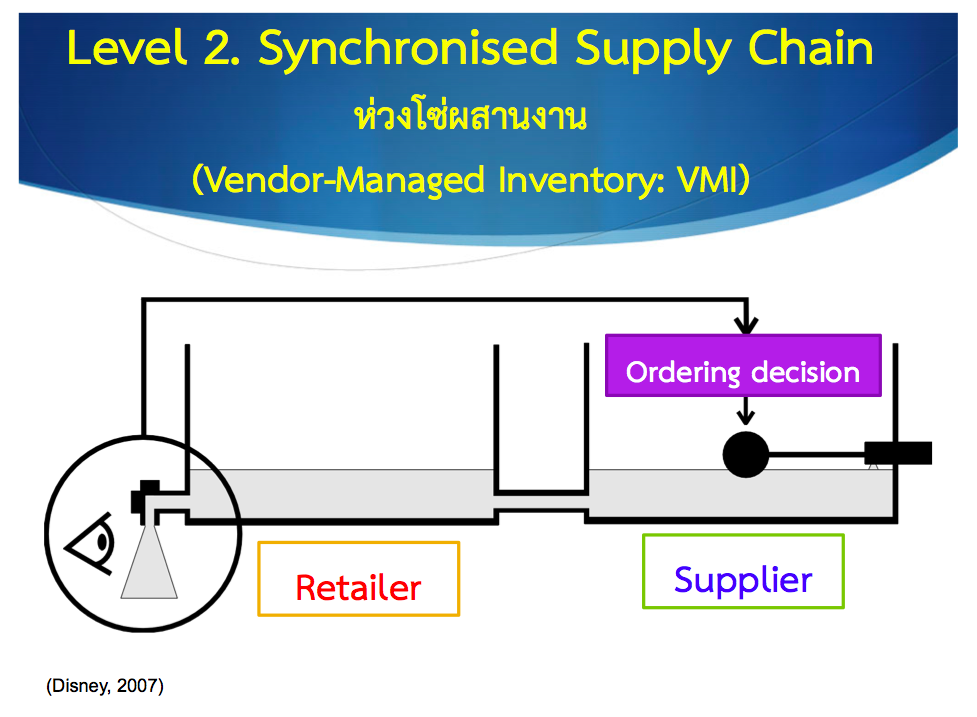
3.2 Supply Chain Collaboration
Download: Slide1 , Value Stream Mapping
Week 4:
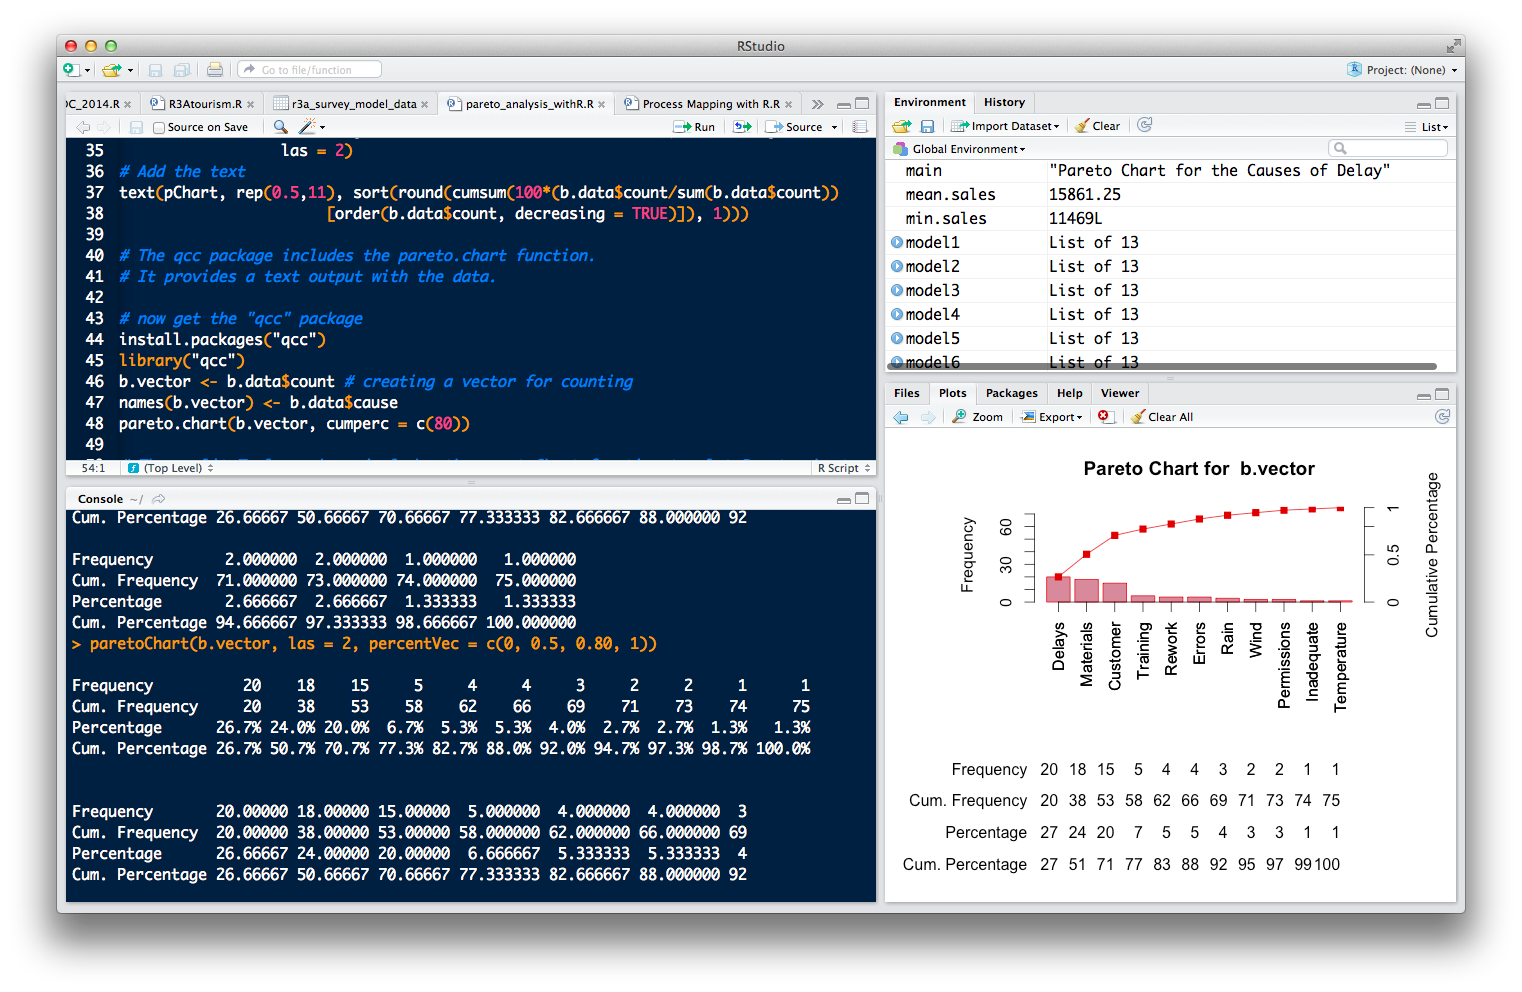
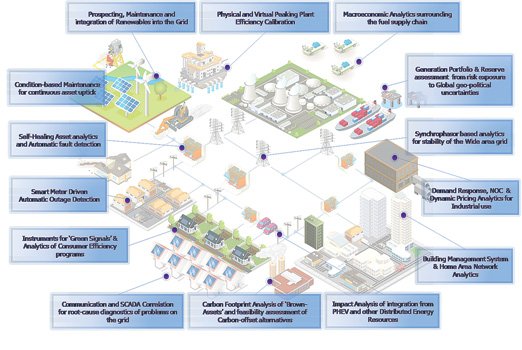
4.1 Supply Chain Analytics (Slide)
4.2with Application with R (Software)
R-Code
- Regression and Time series in R
library(datasets)
?datasets
# test the efficiency of the the car (mpg)
attach(mtcars)
plot(hp, mpg)
?lm
# creat a regression model
model1 <- lm(mpg ~ hp, data = mtcars)
~~~~~~~~
# call a summary of the model result
summary(model1)

?abline
# plot the regression line
abline(model1, col = "blue")
###############################################################

# forecast the airpassenger data
AirPassengers

# plot the data
ts.plot(AirPassengers)

# seasonal decomposition
fit <- stl(AirPassengers, s.window="period")

# plot the T/S/I component
plot(fit)

# Task
# apply the stl function to "BJsales" data

# plot the original BJsales data
ts.plot(BJsales)

# transform into the Time Series (ts) data using "ts"
bj.ts <- ts(BJsales, start=c(1964,1),
 end=c(1976,6),
 frequency=12)

# plot the ts data
plot(bj.ts)

# seasonal decompositioning bj.ts
fit.bj <- stl(bj.ts, s.window="period")

# plot the time series components
plot(fit.bj,
 main ="decomposition of BJsales")
A Book Review
All students are required to review a book in relations to logistics and supply chain system. Such books should not be a textbook. A management pocket or a person/company bibliography are recommended. You may find my suggested list here.
Instruction for Personal Portfolio
Use everting in this course, assembling them in a creative way.
Submit in 2 forms
- Offline version (a soft copy of a PDF file and a hard copy).
- Online version (website)
- Suggested to use free platform of www.wordpress.com
- or other platform such as blogspot
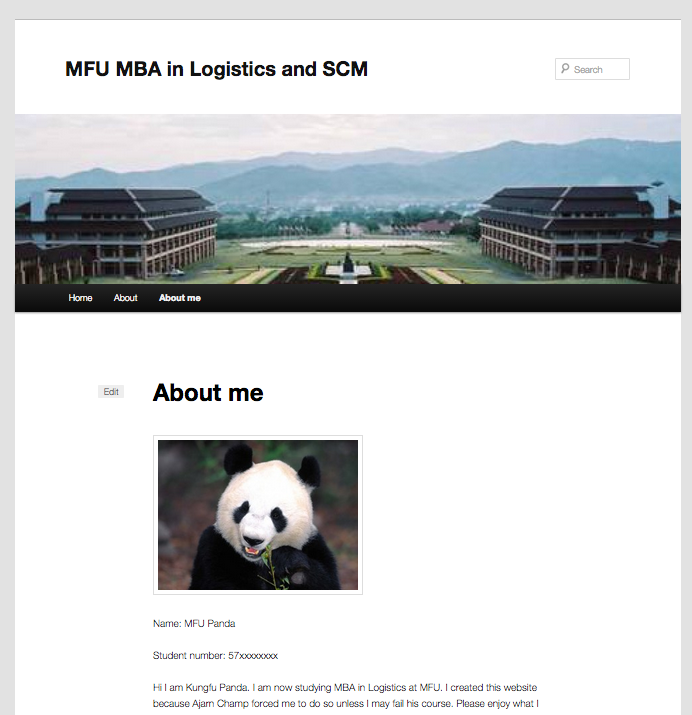
A Sample Portfolio Page
Quiz


Ajan krab,we can’t open course materials on this side.
Ajan krab,we can’t open some course materials (such as 2.1 Supply chain mapping tools…) on this side.
Fixed the links already. Please kindly check again. 🙂
Krab, Thank you