Visualising Tourism Data using R with googleVis package

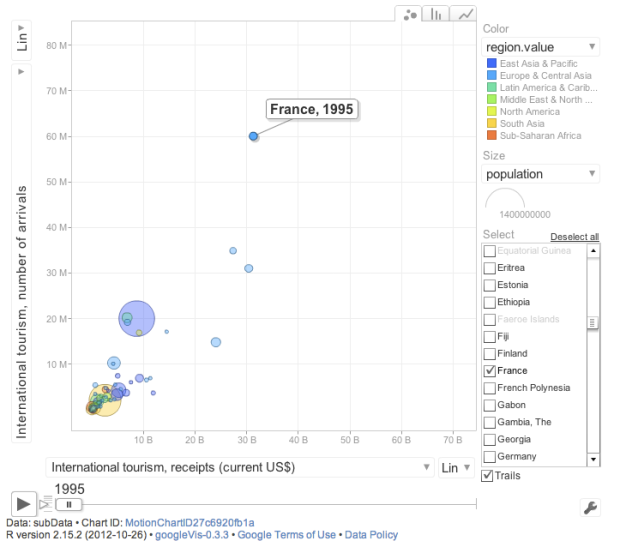
Inspired by Mages’s post on Accessing and plotting World bank data with R (using googleVis package), I created one visualising tourism receipts and international tourist arrivals of various countries since 1995. The data used are from the World Bank’s country indicators.
To see the motion chart, double click a picture below.
Code
install.packages("googleVis")
library('googleVis')

getWorldBankData <- function(id='SP.POP.TOTL', date='1960:2010',
 value="value", per.page=12000){
 require(RJSONIO)
 url <- paste("http://api.worldbank.org/countries/all/indicators/", id,
 "?date=", date, "&format=json&per_page=", per.page,
 sep="")

 wbData <- fromJSON(url)[[2]]

 wbData = data.frame(
 year = as.numeric(sapply(wbData, "[[", "date")),
 value = as.numeric(sapply(wbData, function(x)
 ifelse(is.null(x[["value"]]),NA, x[["value"]]))),
 country.name = sapply(wbData, function(x) x[["country"]]['value']),
 country.id = sapply(wbData, function(x) x[["country"]]['id'])
 )

 names(wbData)[2] <- value

 return(wbData)
}

getWorldBankCountries <- function(){
 require(RJSONIO)
 wbCountries <-
 fromJSON("http://api.worldbank.org/countries?per_page=12000&format=json")
 wbCountries <- data.frame(t(sapply(wbCountries[[2]], unlist)))
 wbCountries$longitude <- as.numeric(wbCountries$longitude)
 wbCountries$latitude <- as.numeric(wbCountries$latitude)
 levels(wbCountries$region.value) <- gsub(" \\(all income levels\\)",
 "", levels(wbCountries$region.value))
 return(wbCountries)
}

## Create a string 1960:this year, e.g. 1960:2011
years <- paste("1960:", format(Sys.Date(), "%Y"), sep="")

## International Tourism Arrivals
inter.tourist.arrivals<- getWorldBankData(id='ST.INT.ARVL',
 date=years, value="International tourism, number of arrivals")

## International Tourism Receipts
tourism.receipts <- getWorldBankData(id='ST.INT.RCPT.CD', date=years,
 value="International tourism, receipts (current US$)")

## Population
population <- getWorldBankData(id='SP.POP.TOTL', date=years,
 value="population")

## GDP per capita (current US$)
GDP.per.capita <- getWorldBankData(id='NY.GDP.PCAP.CD',
 date=years,
 value="GDP.per.capita.Current.USD")

## Merge data sets
wbData <- merge(tourism.receipts, inter.tourist.arrivals)
wbData <- merge(wbData, population)
wbData <- merge(wbData, GDP.per.capita)

## Get country mappings
wbCountries <- getWorldBankCountries()

## Add regional information
wbData <- merge(wbData, wbCountries[c("iso2Code", "region.value",
 "incomeLevel.value")],
 by.x="country.id", by.y="iso2Code")

## Filter out the aggregates and country id column
subData <- subset(wbData, !region.value %in% "Aggregates" , select=
 -country.id)

## Create a motion chart
M <- gvisMotionChart(subData, idvar="country.name", timevar="year",
 options=list(width=700, height=600))

## Display the chart in your browser
plot(M)

# save as a file
print(M, file="myGoogleVisChart.html")
15 Comments
Post a comment


Nice post.
You can copy paste the html code in your page source to directly display the motion chart on the webpage.
I did a similar thing for one my posts.
http://programming-r-pro-bro.blogspot.co.uk/2012/08/kaggle-prospect-harvard-business-review.html
Thanks for your kind words.
Your motion chart is also a nice one too. 🙂
However, this blog is hosted in the WordPress.com, which I cannot do so. I think it’s possible in WordPress.org (http://code.google.com/p/google-motion-charts-with-r/wiki/UsingWordPress) or Blogspot likes yours.
## Add regional information THIS DID NOT WORK
wbData <- merge(wbData, wbCountries[c 1=""region.value",
" 2=""incomeLevel.value")" language="("iso2Code","][/c],
by.x="country.id", by.y="iso2Code")
how?
> wbData <- merge(wbData, wbCountries[c 1=""region.value",
Error: unexpected numeric constant in "wbData ” 2=””incomeLevel.value”)” language=”(“iso2Code”,”][/c],
Error: unexpected string constant in “” 2=””incomeLevel.value””
> by.x=”country.id”, by.y=”iso2Code”)
Error: unexpected ‘,’ in ” by.x=”country.id”,”
>
Hi, thanks for the feedback.
I just run the code again but no error found.
Actually I didn’t change that line from the original code below.
http://lamages.blogspot.co.uk/2011/09/accessing-and-plotting-world-bank-data.html
Could you try reproduce the chart in the link above?
yes it worked that way thanks sorry to have bothered you. It is a great piece of software you have made available to the world. Many thanks. There are other variables I am interested than tourism
How do I get more info about what is available at the world bank dataset? Feel free to ignore this question. I should simply search the bank website. But I could not get much headway doing that
You’re welcome.
I actually put the link in the introduction text in the “country indicator”.
Here is the link
http://data.worldbank.org/indicator/all
Replacing the code at the end of the URL of the indicator you want in the line 42 and 46 in the code.
Thanks the link you provided does have the data, but not the id code For example, id=’SP.POP.TOTL’ where do they have a list of these id codes?
I had the same problem….the line was:
> wbData <- merge(wbData, wbCountries[c 1=""region.value"," 2=""incomeLevel.value")" language="("iso2Code","][/c],
Error: unexpected numeric constant in "wbData by.x=”country.id”, by.y=”iso2Code”)
Error: unexpected ‘,’ in ” by.x=”country.id”,”
>
Hi, thanks for the feedback.
I just run the code again but no error found.
Actually I didn’t change that line from the original code below.
http://lamages.blogspot.co.uk/2011/09/accessing-and-plotting-world-bank-data.html
Could you try reproduce the chart in the link above?
Hi Pairach, Thats a cool chart. I am a management guy and started using googleVis for dashboard reporting recently. I am a newbie to R. I am sorry if I sound ignorant but can we share these html links via sharepoint for another person to explore?
Thanks a lot for kind words.
Yes, you can share it.
There is a difference between the code in this page and that in r-bloggers which has the following commands in lines 66-69 that produce the error mentioned by Erin Hodgess:
## Add regional information
wbData <- merge(wbData, wbCountries[c 1=""region.value"," 2=""incomeLevel.value")" language="("iso2Code","][/c],
by.x="country.id", by.y="iso2Code")
However the commands in this page are ok:
## Add regional information
wbData <- merge(wbData, wbCountries[c("iso2Code", "region.value",
"incomeLevel.value")],
by.x="country.id", by.y="iso2Code")
Just wanted to state I’m lucky I happened in your site!