Measuring Emergency Relief Performance of Thailand Floods in 2011
Background
Last year Thailand faced the worst floods in their history. The World Bank (2011) reported that the 2011 Thailand floods were “The biggest damages and losses were in the manufacturing sector, with a total of THB 1,007 Bn (USD 32 Bn approximately)”. The tourism and agricultural sector were also affected and losses approximately THB 95 Bn (USD 3 Bn) and THB 40 Bn (USD 1.3 Bn) respectively (The World bank, 2011).
Therefore, this study aims to evaluate the performance of organisations that took actions in emergency relief for this disaster. We measure performance based on their preparedness for such disaster as well as how they responded to the events. Data collected via GoogleDoc from 382 respondents (victims) were (A) explored and the (B) used to fit with the conceptual model of performance measurement for emergency relief logistics.
A. Preliminary Findings
- Descriptive_GoogleDoc (in Thai)
A chart below shows the proportion of organisations, which samples have got helps.
Highest percentage is unknown organisation, followed by military agencies.

- Interesting Info-graphic obtained using R

What we can get from R
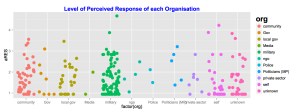
Moving away from the basic barplot instantly provided by Google Doc, we can do a better job to visualise what people rate the performance of each organisation in terms of preparedness and response to the floods. An we can do so via R. Followings are what I produced in R.
1. Level Preparedness

# Boxplot preparedness performance

k <- ggplot(flood, aes(factor(org), aPRE))

k + geom_jitter(aes(colour = org), size = 4) + opts(legend.title = theme_text(size = 20, face = "bold"), legend.text = theme_text(size = 10)) + opts(title = "Level of Perceived Preparedness of each Organisation") + opts(plot.title = theme_text(size = 15, face="bold", colour = "blue"))
2. Level of Responses

# Boxplot response perforance

c <- ggplot(flood, aes(factor(org), aRES))

c + geom_jitter(aes(colour = org), size = 4) + opts(legend.title = theme_text(size = 20, face = "bold"), legend.text = theme_text(size = 10)) + opts(title = "Level of Perceived Response of each Organisation") + opts(plot.title = theme_text(size = 15, face="bold", colour = "blue"))
<pre>
B. Theoretical Output: BAM2012 Paper
Summary
Albeit emergency relief logistics is an emerging field in operations, logistics and supply chain management, the development of performance measurement is still limited. Although one of the objectives of emergency relief logistics is to satisfy customers (victims in the disaster) the development of performance measurement based on victim’s perspective is limited. Then this study propose a measurement of emergency relief logistics performance and tested with an empirical data from the Thailand floods in 2011. We fit the propose measurement model with the data of 382 respondents using Confirmatory Factor Analysis with Mplus version 6 and R version 2.14.1. The result shows that the model is fit with the data. It was found that response had the highest contribution to the total performance, followed by preparedness and recovery respectively. The result also shows that information, operations and evacuation have different contribution to the performance of each stage.
Keywords: Humanitarian logistics, Emergency relief, disaster, floods, Thailand
Download: pdf
R code used in the paper
</pre>
library(lavaan)
 flood1.cfa <-'

PRE =~ x411 + x412 + x413 + x414 + x415 + x416
 + x421 + x422 + x423 + x424 + x425
 + x431 + x432 + x433 + x434

RES =~ x511 + x512 + x513 + x514 + x515 + x516
 + x521 + x522 + x523 + x524 + x525 + x526 + x527
 + x531 + x532 + x533 + x534 + x536

REC =~ x611 + x612 + x613 + x614 + x615 + x616 + x617
 + x621 + x622 + x623 + x624 + x625 + x626 + x627
 + x631 + x632 + x633 + x634 + x636

PEF =~ PRE + RES + REC

'
 fitFlood1 <- cfa(flood1.cfa, data=flooddata)
 summary(fitFlood1, standardized=TRUE, fit.measures=TRUE)
<pre>


Trackbacks & Pingbacks